
↓ 31%
nitrogen waste, first season.
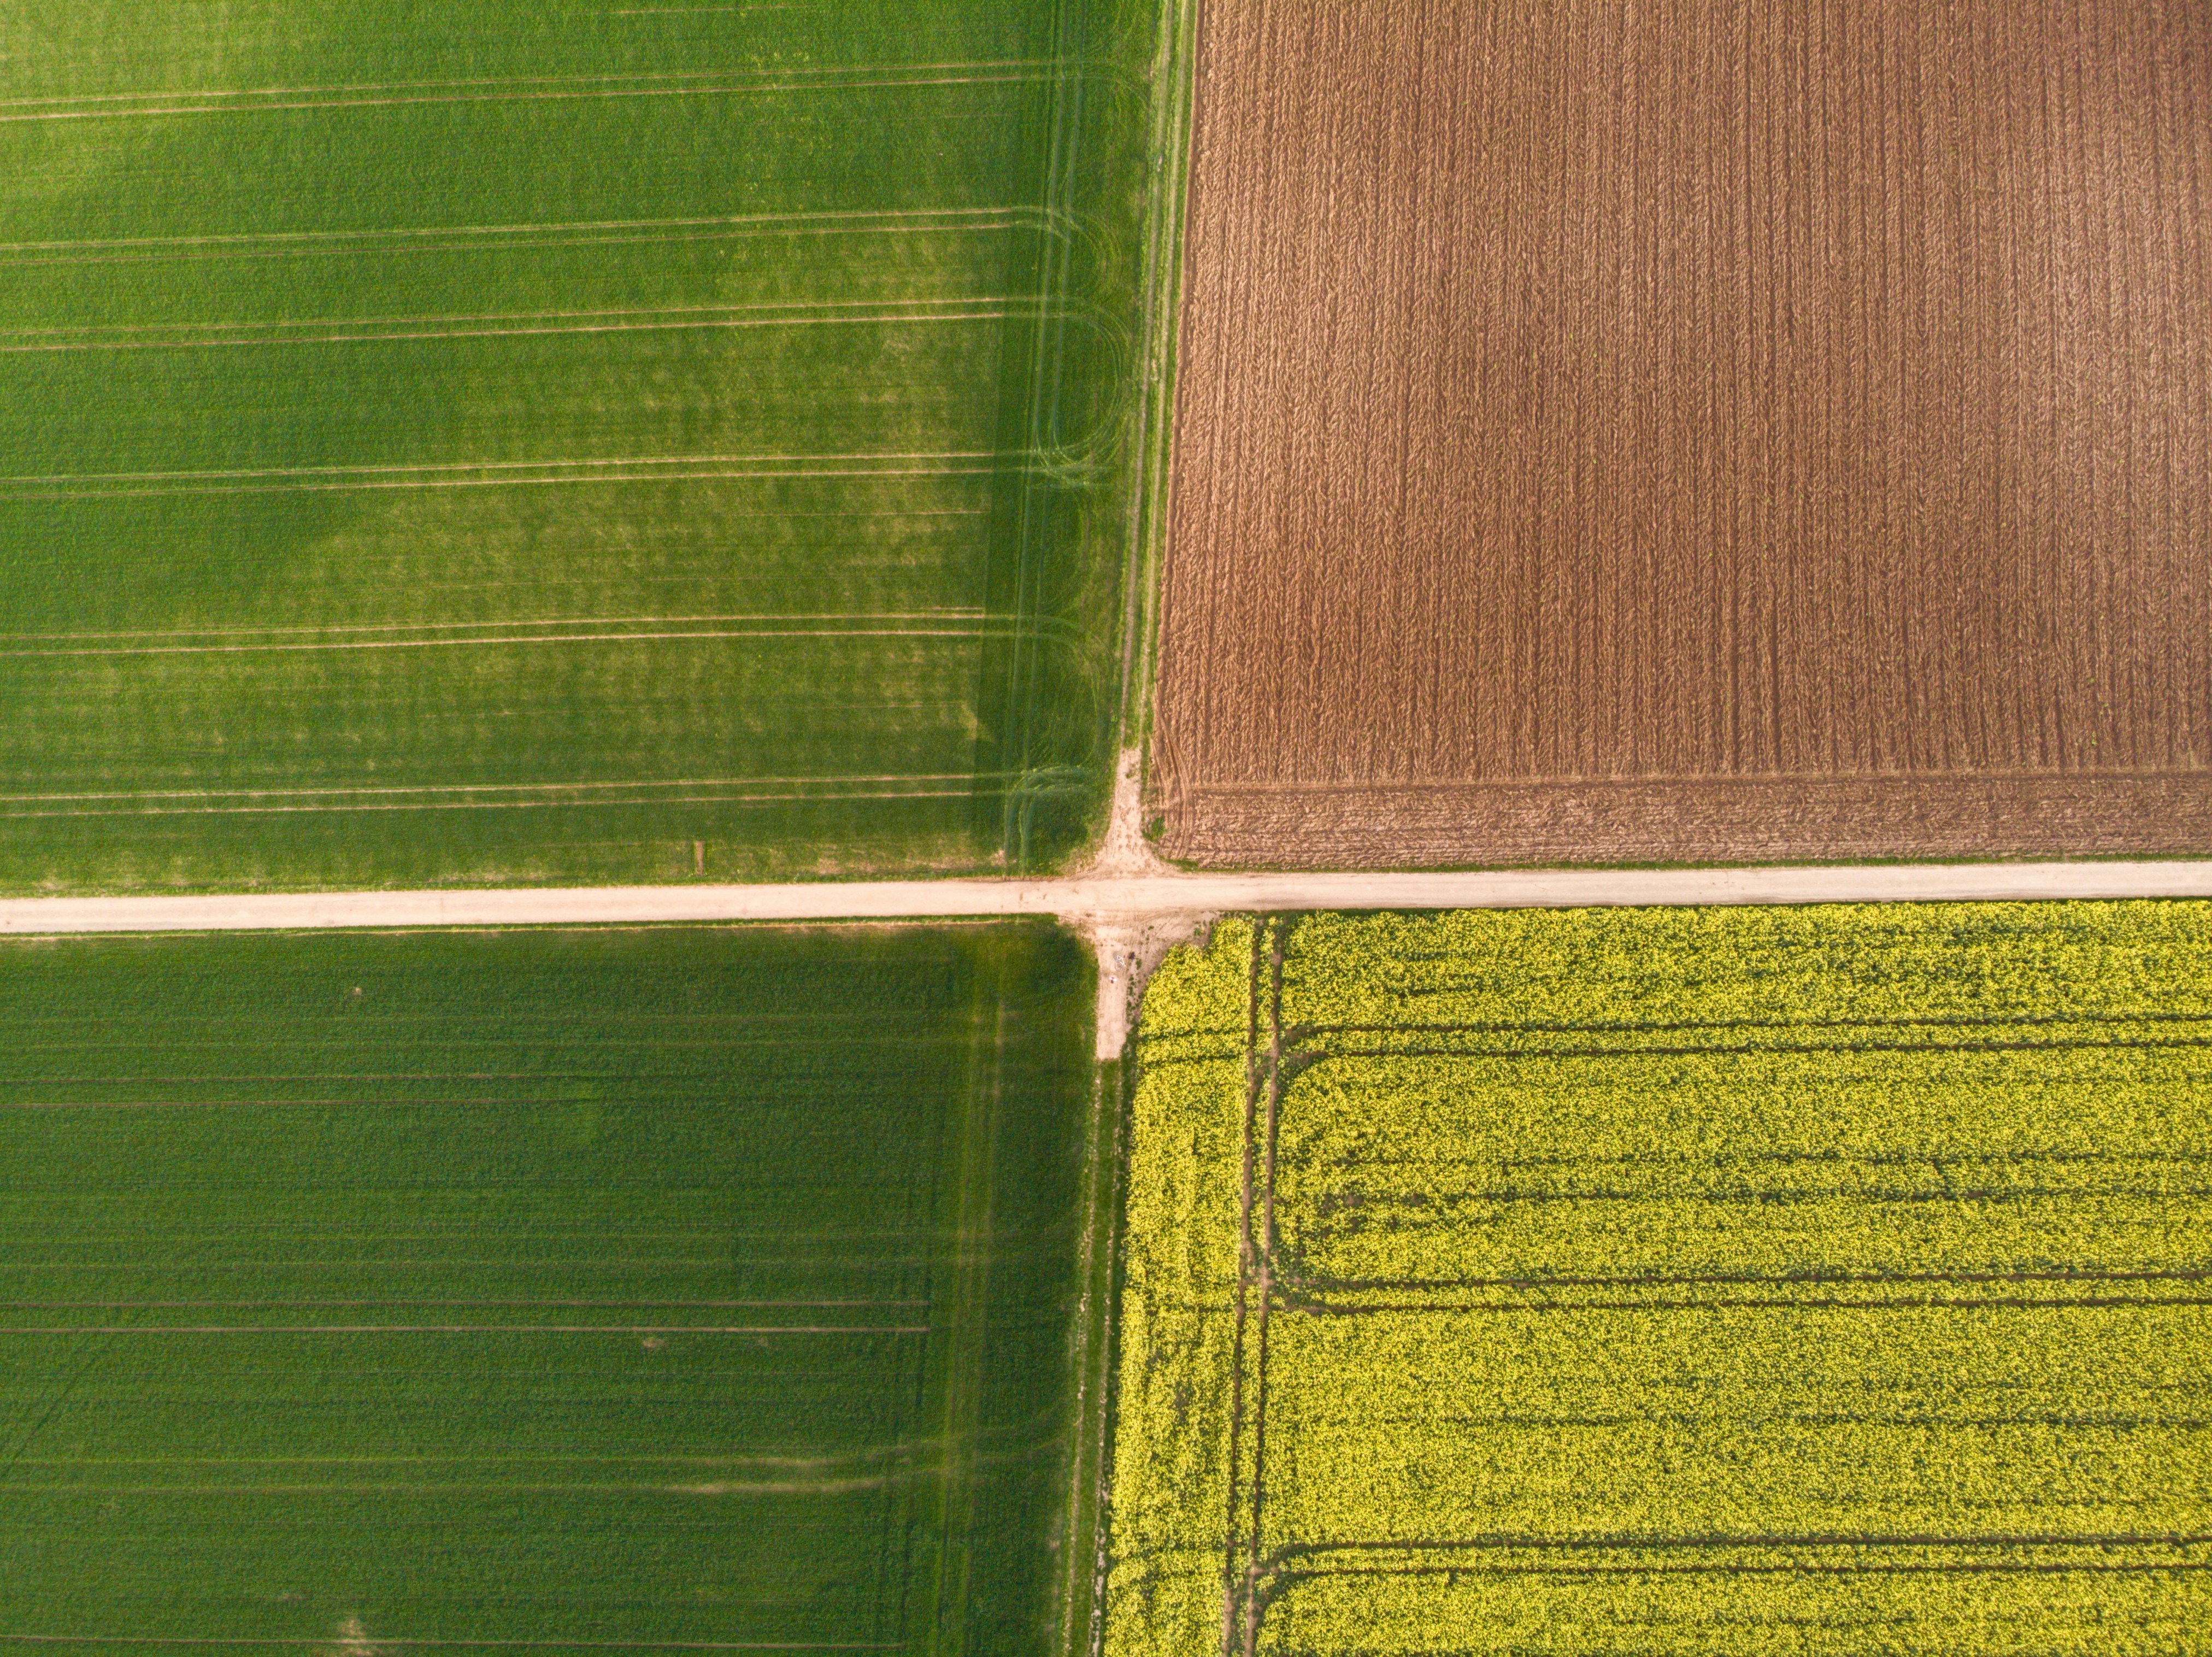
Soil sensors every forty feet. Drone sweeps every week. Satellite overlays every morning. Your grandfather's intuition — confirmed with data.
2,400acres
avg. farm monitored
847gal/ac
water saved annually
7 mo
avg. ROI payback
nitrogen waste eliminated in the first growing season.
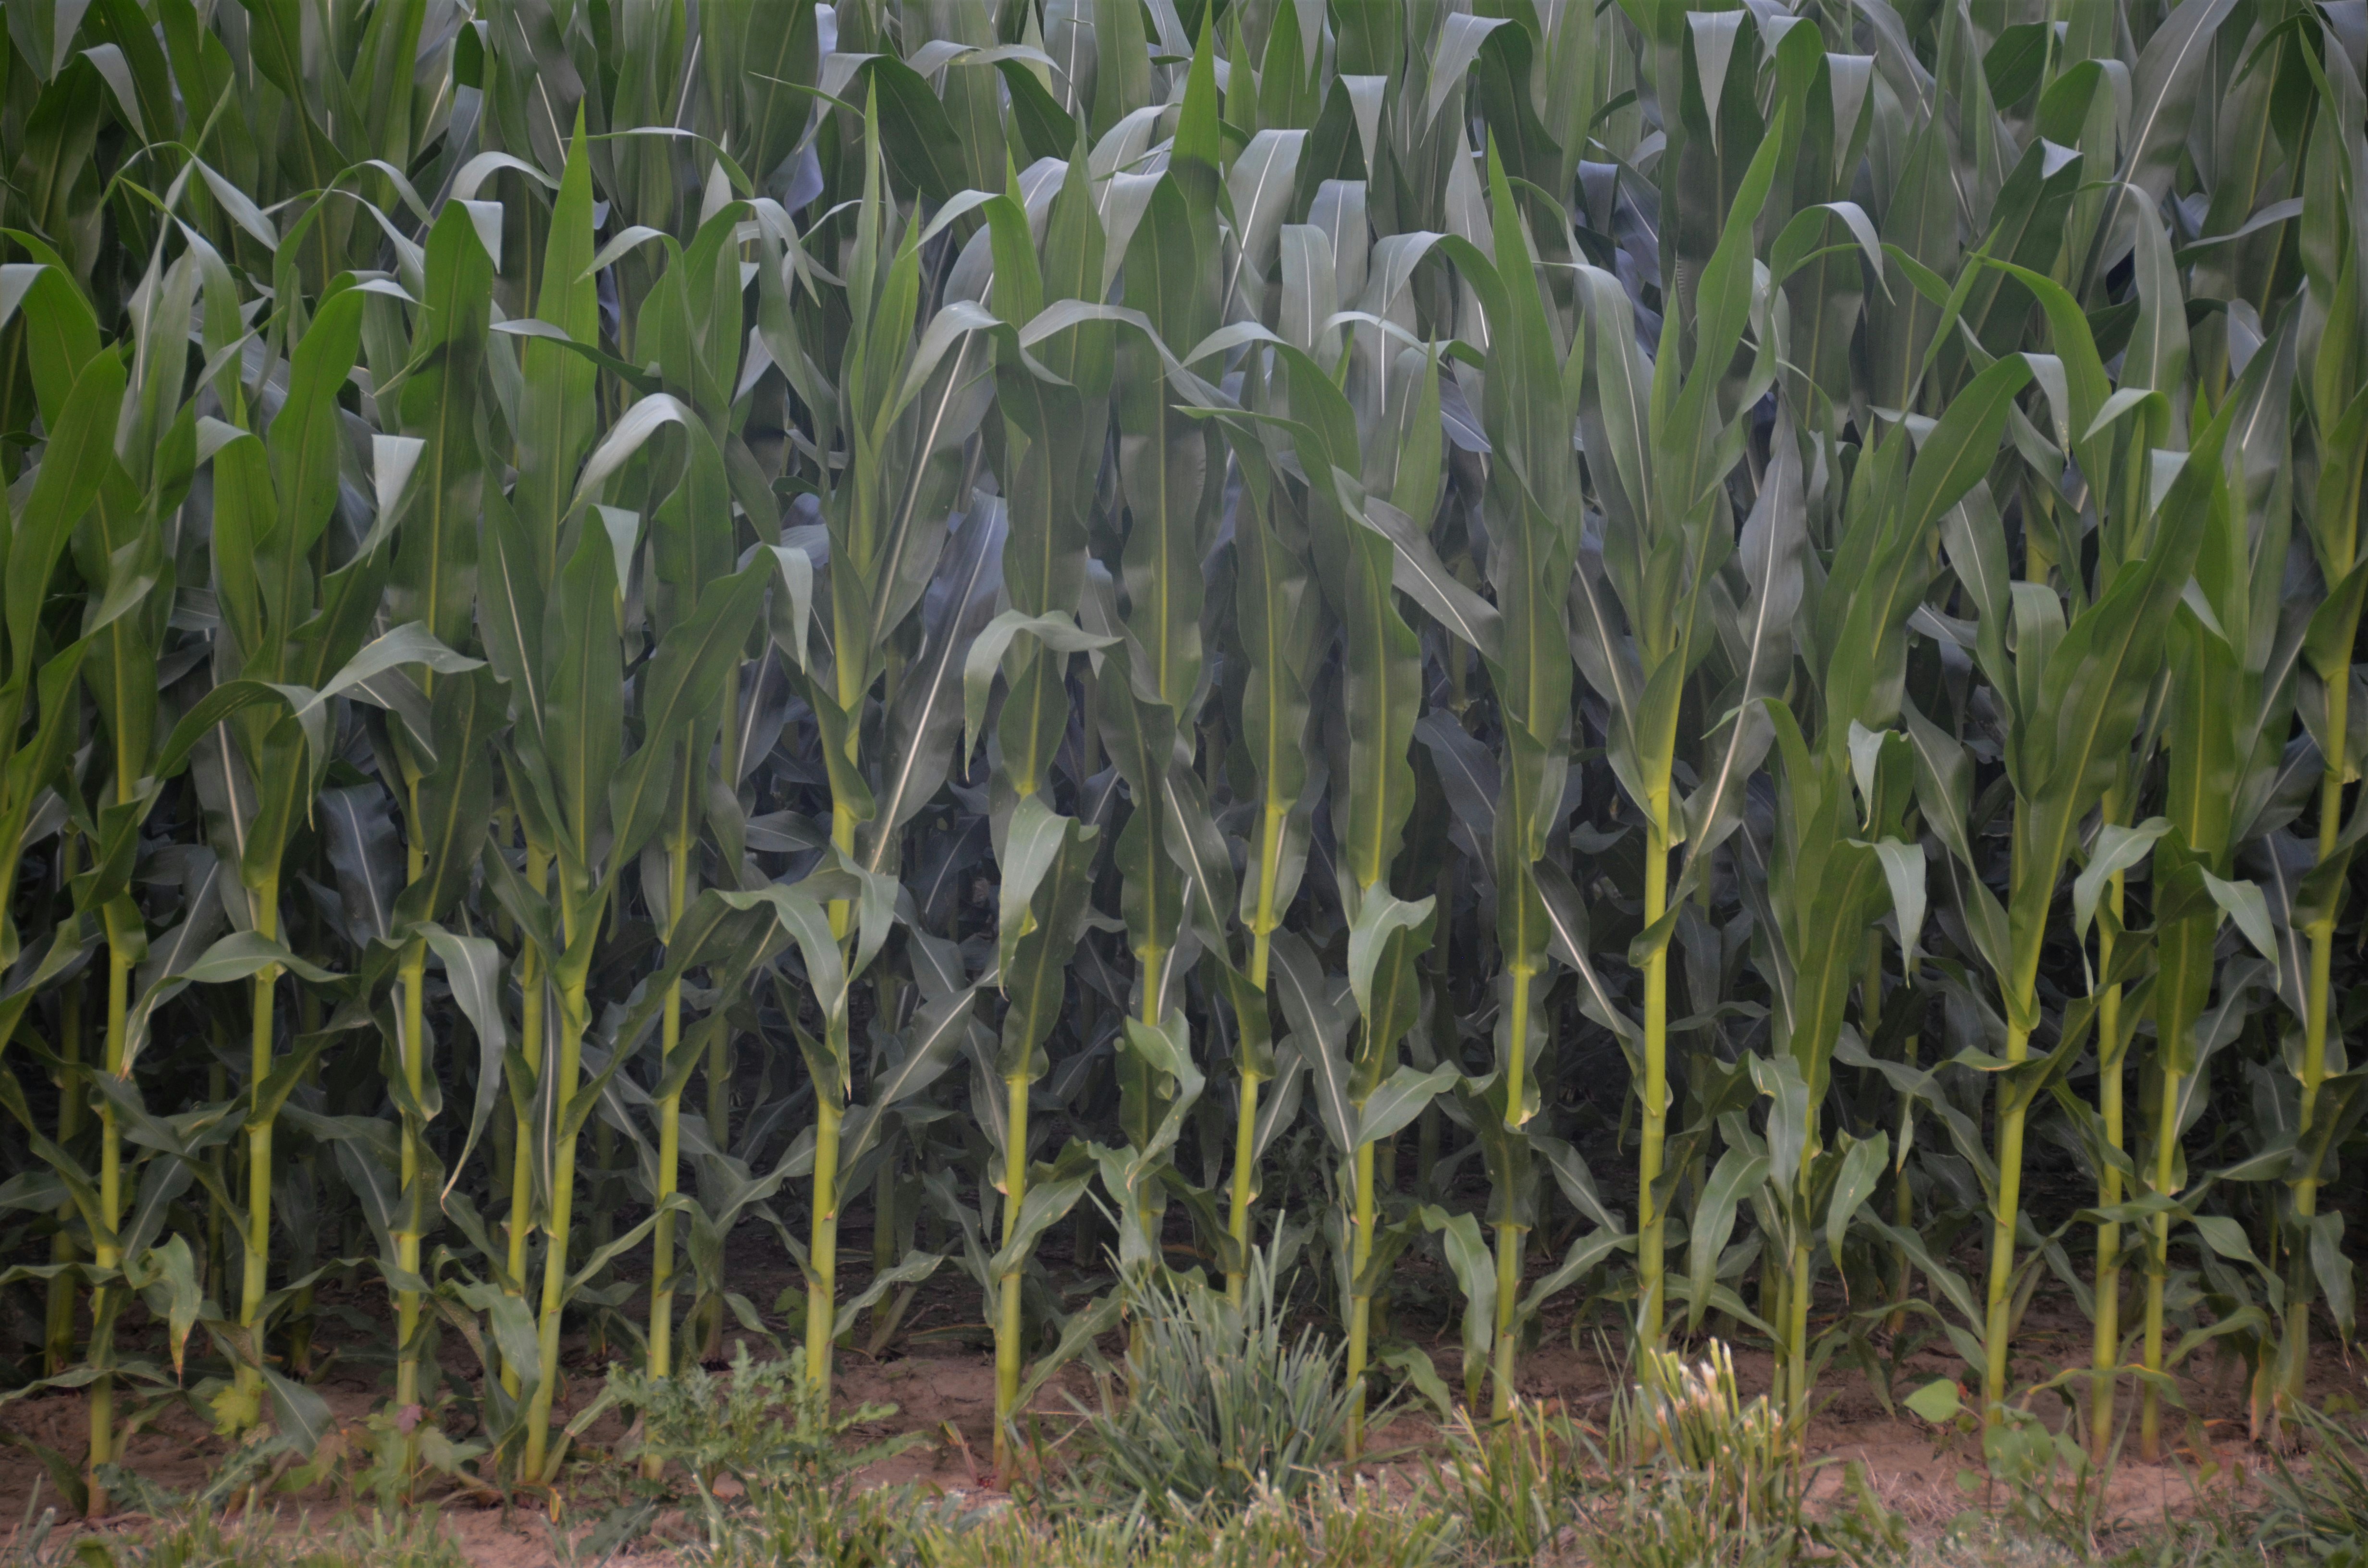
Sensors placed every 40 feet across your fields measure moisture, nitrogen, phosphorus, and pH — every 15 minutes, all season. The system flags the exact row that's running hot before you've finished your morning coffee.
1 per 40 ft
Sensor Density
15 minutes
Reading Interval
N · P · K · pH
Nutrients Tracked
±0.3% variance
Accuracy
gallons per acre saved annually.
On a 2,000-acre operation, that's 1.7 million gallons — and $34,000 in irrigation costs.
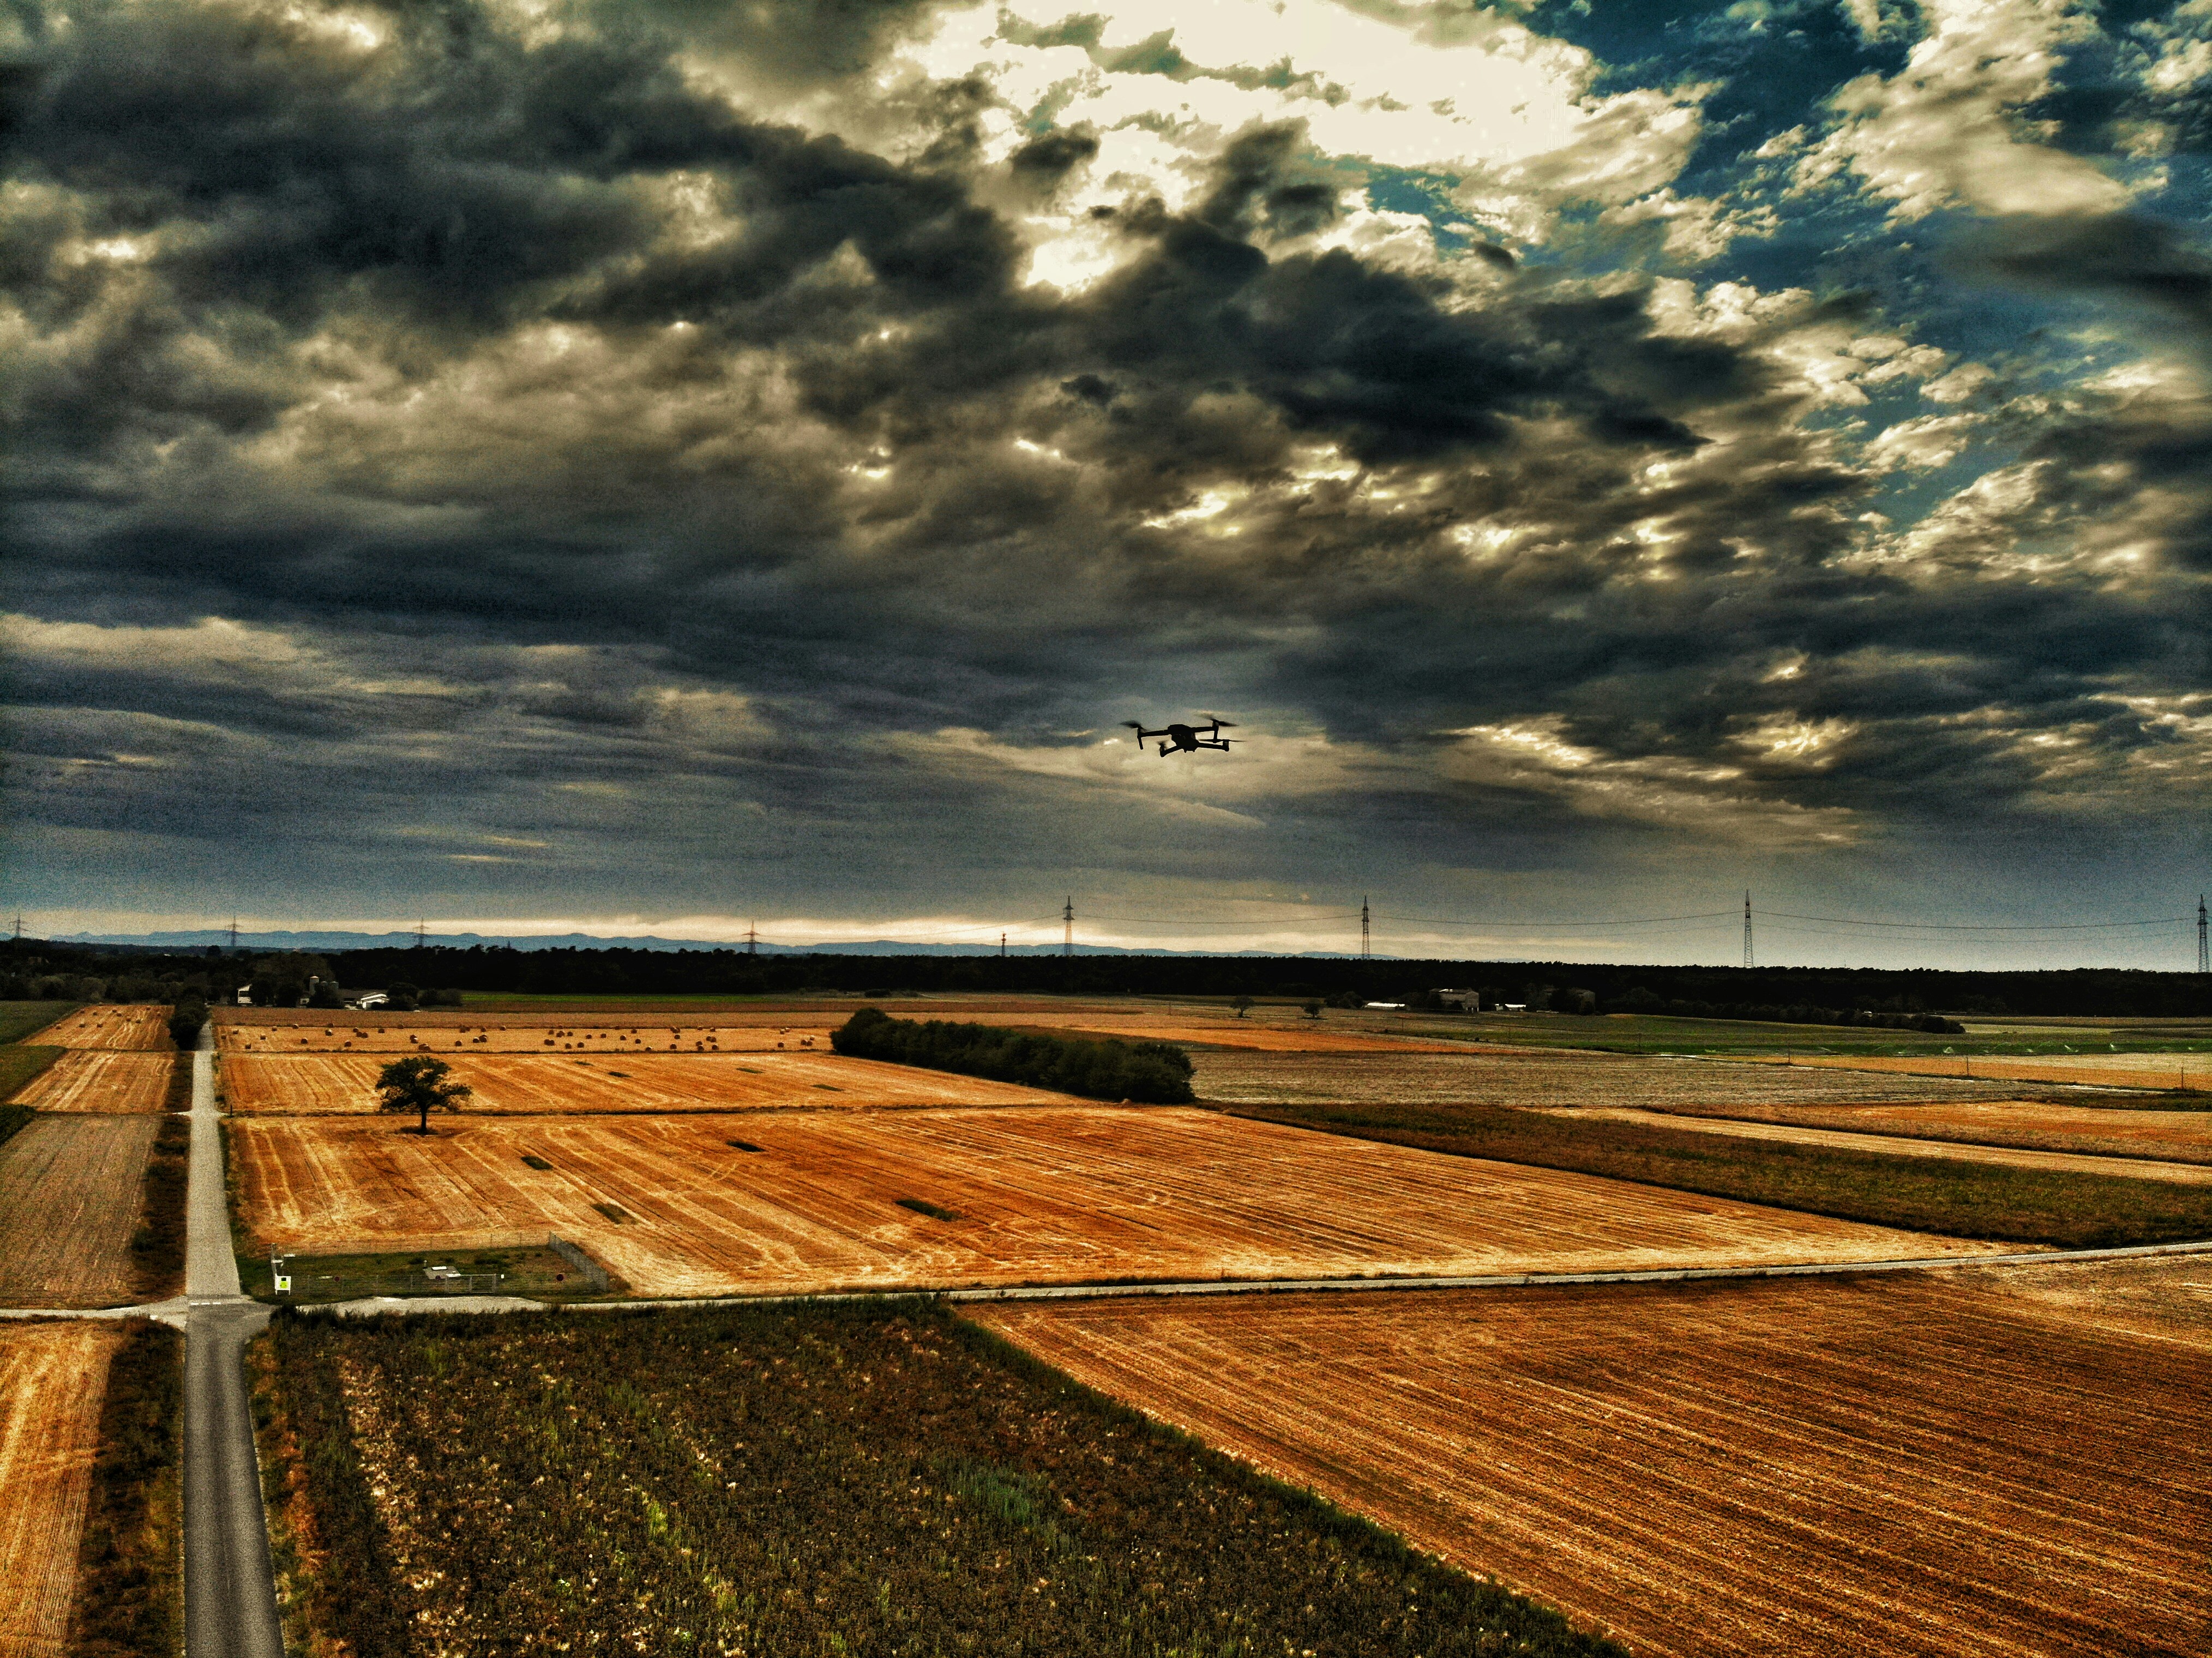
Weekly drone sweeps build a centimeter-resolution NDVI map of your entire operation. The system identifies the exact quarter-acre that's water-stressed 72 hours before visible wilting — before yield loss is locked in.
Sweep Frequency
Weekly during growing season
Resolution
3cm/pixel NDVI mapping
Alert Lead Time
72 hrs before visible stress
Coverage Speed
500 acres per flight
average ROI payback period.
Dairy families averaging $41,000 saved on fertilizer in year one. Row-crop operators adding 18 bushels per acre on variable-rate zones. Co-op managers filing sustainability reports that satisfy grain buyer audits in under two hours.
corn yield on VR zones
fertilizer spend, year 1
sustainability reporting
Three numbers already made the case.
Now tell us where your fields are — and we'll show you exactly what's happening in them.
Map My Fields
A Yield agronomist will build your field intelligence profile and send a zone-by-zone report within 48 hours.
See Your County's Benchmarks
We've aggregated yield, water, and nitrogen data from 4,200 farms across 180 counties. See exactly how your operation stacks up — free regional PDF, just your email.
Trusted by operators across the Corn Belt
4,200+
farms monitored
180
counties covered
$2.1B
crop value managed
"The nitrogen map paid for itself in the first application. My grandfather would've called it cheating — I call it farming smarter."
Randy Hoffmann
2,340 acres · corn/soy · McLean County, IL